Lesson 8 — 3D scatterplot – TEST
By Administrator
First published on July 17, 2019. Last updated on July 17, 2019.
Learning Objectives
Create 3D scatterplots
Demonstration
Here is the dataset that we are using in this demo:
This dataset is about Down’s Syndrome in Canada. (I have slightly modified the original dataset for our purpose).
https://vincentarelbundock.github.io/Rdatasets/doc/boot/downs.bc.html
We will first import the dataset. Then we will generate a 3D scatterplot from the dataset downs_bc. See below for details.
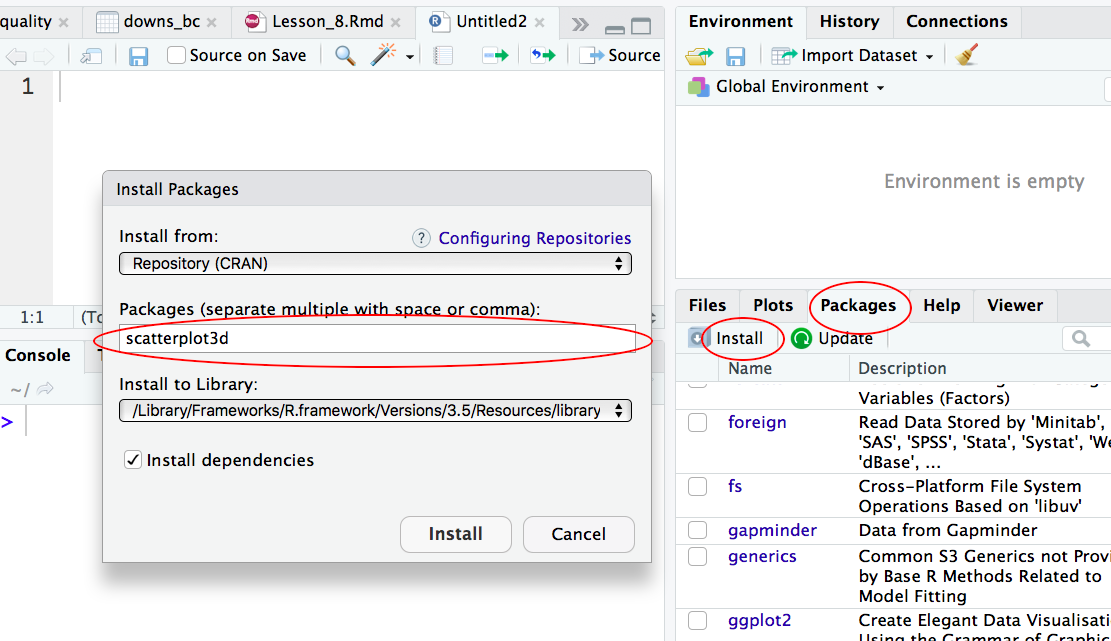
Step 1: Install the R package “scatterplot3d”
Two ways to install a R package one way is to type install.packages(scatterplot3d); the other way is to install via the graphical interface of RStudio:
Step 2: Install the R package “scatterplot3d”
Before we can use the R package to create 3D scatterplots, we need to load the package into R first:
> library(scatterplot3d)
Step 3: Create a 3D scatterplot
Our dataset is called downs_bc. We want to generate a 3D scatterplot for the three columns in that dataset: cases, age and births.
> library(scatterplot3d)
> with(downs_bc,
+      scatterplot3d(cases ~ age + births, pch = 19,
+                    main="Incidence of Down's Syndrome",
+                    xlab="Age", ylab="Cases", zlab="Births"))
Explanation:
We use the library function to load the R package “scatterplot3d“.
Then we use generate the 3D scatterplot from the databset downs_bc:
cases ~ age means that the variable cases is explained by age (i.e. age is the explanatory variable);
+ births means that the variable births is the third variable in this scatterplot;
pch = 19 means to use plotting symbol 19 (solid circle) in our plot. (Type ?pch at the prompt to find out more about pch.)
Here is the 3D scatterplot: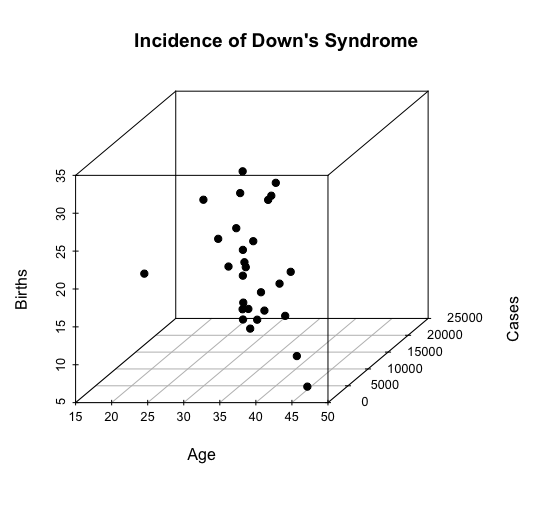
-END-