Modeling Historical Dynasties
By Mark Ciotola
First published on October 11, 2019. Last updated on October 11, 2019.
Modeling Historical Dynasties
By Mark Ciotola
First published on October 11, 2019. Last updated on October 11, 2019.
Table of Contents
This course concerns modeling the rise and fall of historical dynasties. At one level, the approach is empirical. However, this approach can be tied to physical quantities and unifying physical and social principles.
First this course considers whether history can be modeled. Then it discusses the emergence of dynasties. Generating models of dynasties using the Efficiency-Discounted Exponential Growth (EDEG) approach is presented and tested. Then the structures of dynasties are explored as well as secondary level trends and events.
-
1 Modeling History
First published on . Last updated on February 6, 2021.
“Can history be modeled?” The simple answer is “It depends.” A better question is “To what extent can historical phenomena be modeled?” There is so much in history to explore to answer this question. At any point of time in history, there are societies, governments, institutions, families and individuals. Each of these has physical and social aspects, as well as connections to each level and their peers.
There are many kinds of models. Many children and some adults have built models of airplanes or assembled small blocks into what houses and other structures either are or should be. Historical models can include physical reproductions of past objects. However, we will generally be referring to social, economic and psychological models of individuals and groups over periods of time. Our models will typically be on paper, device screens or in computer memory.
One can just go ahead and make a model. Simply hypothesize that something will increase or decrease over time. However, for the purposes of advancing history as a field, it is more useful to create models that can be tested against real data, or at least as good of data as we can obtain.
In this course, we discuss how to use fast entropy and other methods described in this text to model historical dynasties.
References
[1] Note that dollar amounts are unadjusted for inflation — they reflect actual historical figures.
[2] See M. Ciotola, Journal of Physical History and Economics, Vol. 1, Is. 1 (1996).
Gibson, C. (1966) Spain In America. Harper and Row.
Smith, D. (1982) Song of the Drill and Hammer.
-
2 Emergence of Dynasties
First published on . Last updated on October 11, 2019.
Introduction
The term dynasty is used broadly to refer to a continuous ruling group; it could be a related family but does not have to be. The term regime can also be used. The term society refers to a group of related people, typically of a single or similar group of ethnicities, such as the Han people in China or the Frankish people in France. Dynasties exist within a society, but can conquer other societies as well.
Fast Entropy can drive the formation of dynasties or regimes. Within the context of a civilization progressing over millennia, it is often possible to degrade built-up potential even more quickly even given current types of social structures for a particular society. Hence, dynasties form to more quickly achieve that potential (just as a convection bubble forms in a boiling pot of water to release heat more quickly). Dynasties result in more rapid degradation of energy than does a more static society.
Each dynasty has a life cycle. A dynasty is similar to an individual biological organism than a swinging pendulum. A dynasty is born, matures, endures for awhile, then dies. A new dynasty will not necessarily follow an old one, or might not immediately appear. Yet dynasty will continue to form as long as there exists a potential that cannot be more quickly achieved by other means. Does a dynasty have to have a life cycle. Could it not last forever, or at least indefinitely? Societies and some institutions can last much longer than dynasties. It is conceivable that a dynasty could be managed in a sustainable manner, but this is not what we typically observe in history.
Why has the 300-year pattern appeared so frequently in history from France to China to West Africa? It could be that humans who organize in large, durable regimes traditionally chose monarchies. It could be that the values that lead to success and failure go through a roughly fifteen generation progression. It could be that these regimes have utilized the same sort of resources such as agriculture, and perhaps land becomes excessively exhausted after about 300 years. Conserved social resources could include good will or social flexibility. Property rights, concentration of wealth and gentrification could eventually petrify a regime. Or, this could be viewed in terms of a standard 300 year predator-prey prey scenario. Movements towards stabilization can be described as a march towards thermodynamic or statistical equilibrium. There is a short term type of equilibrium related to on-going flows and a longer-term equilibrium that relates to the “life-cycle” of the regime itself.
Considering Dynasties As Bubbles
A human society can experience bubbles. A new dynasty within a civilization encounters a potential of good will and other physical and social resources, albeit of fixed magnitude. The society governed by the dynasty fills the role of a collection of heat engines, producing both work and entropy. Prosperity expands exponentially, increasing the consumption of potential entropy exponentially. Eventually, it becomes increasingly difficult for the dynasty to rely upon its store of goodwill and physical and social resources, decreasing its efficiency. As efficiency decreases, the dynasty will experience social crises and will eventually stop functioning.
Summary
So far, the discussion has been largely speculation. The correct application of factual evidence will demonstrate to what degree the above is valid. The underlying mathematical formulae will be proposed in other sections. This approach is different than mere philosophy or opinion, because it is capable of being numerically disproved or restricted to limiting cases.
-
3 Modeling A Dynasty Using EDEG
First published on . Last updated on March 11, 2020.
Introduction
This section concerns generating models of the rise and fall of power of dynasties versus time and how a single dynasty can be modeled using the efficiency-discounted exponential growth (EDEG) approach.
This sort of model can be called a power progression. Various approaches to modeling dynasties will be explored, then a new physical approach will be proposed. All of the approaches presented are simplifications that assume a gradual rise and fall. Of course history is rarely so cooperative. Hence, the models shown should be considered mere first approximations. Mathematical treatment of dynasties will be novel to most historians, so simple approaches will be discussed first, and more complex ones later.
It is simpler to model a sufficiently large, robust, independent dynasty than one that existed merely at the whim of its neighbors, for there are less significant dependencies, and thus can be approximated as a substantially isolated system. So we will utilize Russia’s Romonov dynasty as an example. Widely accepted start and end dates are 1613 and 1917 (Mazour and Peoples 1975). Peter the Great and Catherine the Great were the two important rulers of the Romanov dynasty, and the Russian Empire gained much of its most valuable territory by the end of Catherine’s reign. The Romanov dynasty was big, robust and essentially independent. It fought wars, but it generally was not under serious threat of extinction. Even Napoleon could not conquer Russia, but rather Russia nearly conquered Napoleon. This dynasty was reasonably long-lived, rather than just a quick, “flash-in-the-pan” empire.
By developing a fundamental approach to modeling the rise and fall of dynasties, it is possible to accept or reject models based upon both qualitative historical evidence and quantitative historical data.
A regime can be a dynasty or corpus of government. A society here is defined to be a particular people or culture over time. The people occupying the area of modern day France from the time of the Frankish invasions to the present could be viewed as French society. A dynasty, such as the Capets in France, would be viewed as a regime. The nominal term “government” does not always describe a regime, however. A regime can be recognized by having a clear rise and fall connected with production or consumption of a critical resource.
Historical dynasties are consumers of energy and producers of power, so models in terms of such quantities are inherently fundamental in that they can be derived directly from the laws of physics and expressed in physical quantities. Such models are not theories of everything, but rather describe certain types of broad macro-historical phenomena rather than the intricate workings of the interactions of individual people.
The term energy is meant in the physical sense here. There are several possible measures of the physical energy of a dynasty, such as population governed or grain production. Each of these is translatable into physical units of energy. For example, the quantity of people multiplied by the mean Calorie diet per person will result in an amount in units of energy. These figures can be estimated for most dynasties over their lifespans, albeit with differing degrees on uncertainty. The proportion of this energy that rulers of the dynasty actually have at their disposal is beyond the scope of this paper, but should be considered for improved accuracy.
Power is a physical term. It refers to energy expended per unit of time. Yet it also has meaning within social and political contexts, and will be discussed in both senses. Absolute power would generally be presented in physical units of power such as Watts. However, it is possible to express any type of power in terms of proportions, such as the ratio of power at a dynasty’s peak to its start date. Such a ratio can apply to physical, political or even military power. So the EDEG approach can be utilized to model any type of power. In fact, the EDEG approach provides a framework to explore the question of how political and physical power are related.
Exponential Growth Component
A new regime will tend to experience exponential growth. A chief characteristic of exponential growth is that growth feeds even more growth, resulting in an increasing rate of growth. Increases in population and consumption can become explosive. Nevertheless, the growth rate in early stages tends to be relatively flat, while the growth rate later on tends to be relatively steep. In reality, the change between “flat” and “steep” can be surprisingly sudden despite warning signs.[1] Incidentally, the transition from flat to steep may be more painful than graceful for many people. Regimes that are unprepared can suffer greatly.
Example of Mechanism of Exponential Growth
Recall our example of heat engines begetting heat engines. That is an example of exponential growth, because the rate of growth of heat engines was proportional to the existing population of heat engines at a particular instant.
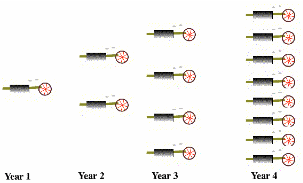
Reproducing engines
Theory—Pure, Unlimited Growth
Sources of growth can include geographic expansion, infrastructure improvements and trade expansion. It will be assumed that dynasties will strive to grow exponentially. (This paper does not attempt to prove this assertion, but rather it is a rebuttable presumption). If so, this certainly explains the rise of a dynasty. There is a minor distinction between exponential growth and compounded growth. Exponential growth essentially involves continuous compounding which produces a larger effective growth rate than discrete compounding. It is similar to the difference of quarterly versus daily compounding of a bank savings account. This effect is less significant at small growth rates but more so at very large rates. For the growth rates that we will consider, the effect is negligible compared to the other sources of uncertainty that exist.
The Romanov dynasty with various growth rates is shown below. The plot shapes appear similar, except that a greater rate produces a “sharper” corner. Also, notice the range of power values: a greater growth rate produces a disproportionately greater power value at later points of time.
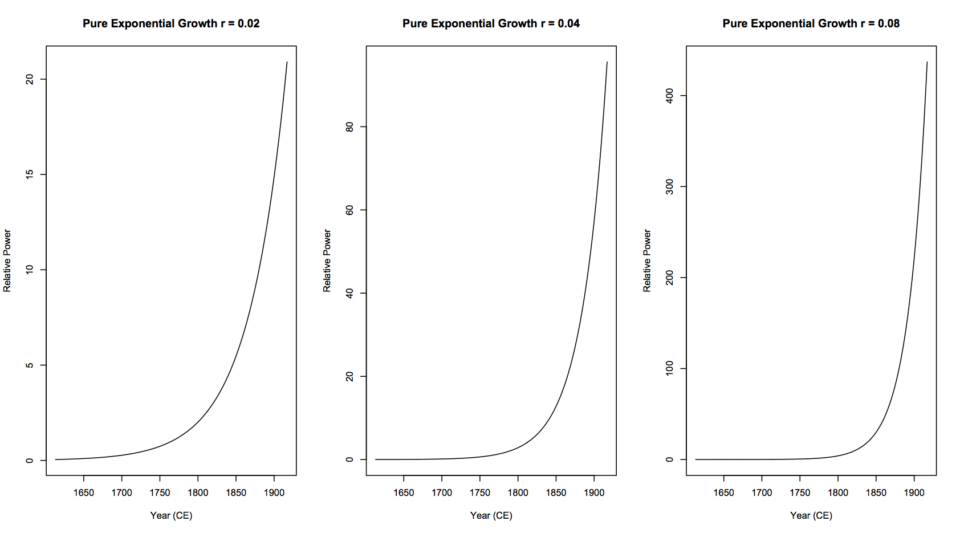
Exponential growth for various growth rates
Efficiency Component
Efficiency is the proportion of consumption that is transformed into production, or its equivalent in power.
Limiting Factors
In reality, there will always be factors that limit the growth even of a self-replicating system. A regime that experiences pure exponential growth will eventually begin to experience such limiting factors.[3]The magnitude of these limiting factors will increase during growth (more than proportionately). These limiting factors restrain growth and sometimes stop it altogether.
Limiting factors usually exist due to a shortage of some essential resource or an excess of some “negative” resource. In a simple case of exponential bacteria growth, limiting factors can include insufficient nutrients and production of excessive toxin. A toxin can reduce or prohibits growth even in a resource-rich environment.
Turning to the biotechnology, an examination of the case of growing cells shows that the chief limiting factors are typically a nutrient limitation or an accumulation of a toxic metabolite.[4]Even in an environment that is overall rich in resources, scaling issues result in the decrease of surface area to volume ratio of the organism colony. In other cases, some cells require a growth surface to anchor to. A lack of oxygen can be a limiting factor for large cell cultures. The organisms often cannot get access to abundant resources because they are crowded out by their neighboring organisms. Multi-cell organisms attempt to overcome the surface area limitation with structures such as veins and folding. However, an elephant still faces many challenges as compared with an ant, such as expelling sufficient body heat.
Human civilization meets a similar surface area challenge with similar structures. The great freeways and road networks in cities and even across the countryside in many ways resemble the blood circulation system in out own bodies.
Another source of limiting factors is the growing cost per unit to extract limited resources such as minerals. Societies attempt to use large-scale social and technical structures to overcome this challenge, but these structures create additional challenges.[5] There are other examples. In the U.S., the “closing” of the western frontier marked a limit of growth to homesteading. In petroleum production, the increasing cost of drilling for oil is a limit to growth. P. Malthus[6]pointed out limiting factors in the growth of agricultural production.
Efficiency Decay
Dynasties inevitably end, which is typically preceded by a decline in power. Exponential growth alone is insufficient. Another physical principle comes to our aid. A dynasty can be viewed as a heat engine (or collection of such). Engines consume a potential to produce work or exert power. As an engine consumes a nonrenewable potential, the efficiency of that engine may decrease. (For physics-savvy readers, picture a Carnot engine operating across exhaustible thermal reservoirs. As heat is transferred, the temperature difference will decrease, and so to will efficiency. (Ciotola, 2003)). Therefore the engine’s net production will decrease and eventually fall to zero.
Likewise, as the dynasty progresses, non-renewable resources will be consumed, and efficiency will decrease. There will still be production until the end, but there will be a lower return on investment, so to speak. Causes of decay can include overuse of agricultural land leading to nutrient depletion, the build-up of toxins in the environment, depletion of old growth forests, and even running low on social goodwill.
There are two types of decay, linear and exponential, compared in the plot below. Note that efficiency is shown as a multiplier rather than a percentage. (Multiply by 100 to get a percentage).
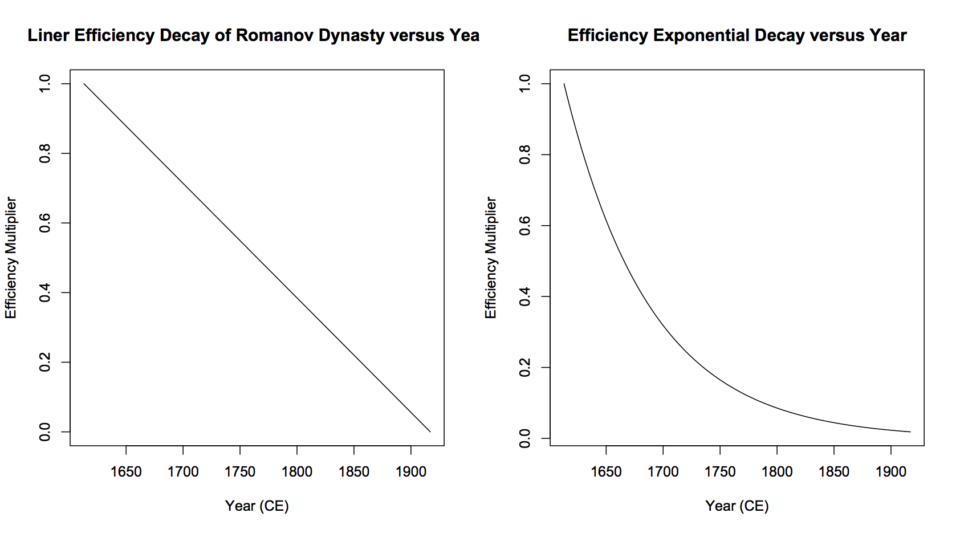
Linear vs decay efficiency
A regime, past its prime and dependent upon a limited resource, may experience exponential decline. Exponential decline in an EDEG situation can happen more quickly than exponential growth. However, there are two disadvantages of exponential decay within the context of modeling dynasties. First, it is slightly difficult to set up. For example, exponential decay has an infinitely long tail. While this allows for mathematical immortality, most of the tail is superfluous in the context of a dynasty of limited lifetime. Second, it may not provide the most consistent models with observations.
A linear approach as simpler to set up. Importantly, it also provides some reflection of efficiencies achieved through centralization and economies of scale as the dynasty progresses. It has unambiguous beginning and end points. Efficiency cannot be greater than one, and is typically no lower than zero. Therefore, as a first approximation, one can set the efficiency to 100% at the start date of the dynasty and 0% at the end year (except that the math is simpler if the value 1 is used for 100%). Using a value of 0 for ending efficiency ensures that the dynasty actually does end by its historical end date. Although physical efficiency is typically lower than 100% for real life heat engines, 1 provides an easy starting point that also produces the correct shape of curve. The following is an example of linear decay function:
\(efficiency = 1 – \left( \frac{year – start~year}{end~year-start~year} \right)\).
As the year increases, efficiency will decrease. Using a lower initial efficiency reduces the magnitude of production increase for the dynasty compared to its initial production. It also flattens out the curve. Using a value of zero for ending efficiency ensures that the dynasty actually does end by its historical end date. It is possible to use a value other than zero for the ending efficiency, but then some other factor must be used to end the dynasty.
Double Injury—Declining Efficiency Can Occur Even As Resources Become Very Scarce
The key impact of limiting factors, whether insufficient positive resources or excessive negative resources, is a decrease in the efficiency of whatever is acting as the “heat engine” to do work.
Even where the EDEG function appears symmetric, the intrinsic efficiency function can be extremely asymmetric: high in the beginning and low towards the end.
Centralization can produce economies of scale that can boost net efficiency, but when a centralized system goes bad, it can go really bad. It can be difficult to go gradually to a less centralized system, and failed central institutions can bring a regime crashing down quickly. This is an example of an irreversible process.
Exponential Growth Where A Nonrenewable Resource Exists
We still need to go a step further.
The effect of limiting factors, even upon exponential growth, is that growth will either reach a plateau or will become negative. In all cases, given sufficient time, growth will become negative, and that negative growth shall substantially cancel out past positive growth. Here, growth refers to that derived from consumption of a critical limited resource.
Production in a society is ultimately dependent upon a scarce, conserved resource. The term conserved means that the resource is non-renewable. The total amount everrecoverable cannot exceed a fixed quantity. In the case of a gold mine, certainly no more gold than is already present in the mine can be captured. A regime will typically consume both conserved andrenewable resources. It is the consumption of the critical conserved resource that shall determine the growth characteristics of the regime.
So now we bring exponential growth and declining efficiency together. We need to use the decay to discount exponential growth, just a little in the beginning, then completely at the end.

Linear vs decay efficiency
Growth will not only slow down but often will actually start to reverse. Such growth and decline can be represented by a EDEG function, where the area under the curve represents either the total production or consumption of a conserved resource over time.
Note that the critical resource becomes more expensive as each successive unit of it is utilized. In the case of petroleum or a precious ore, the least expensive deposits are extracted first. Then the next least expensive deposits are extracted and so on.
The following is an example of an EDEG equation:
\(y = exponential~growth~function * efficiency~function\),
where * is a multiplication symbol. Here is a simple way to generate a quantitative model for a dynasty. It is simplistic, but it produces generally qualitatively correct results. Assume exponential growth:
\(P_t = P_0 e^{kt}\),
where \(P\) is power, \(P_0\) is initial power, \(t\) is time and \(k\) is a constant of proportionality.
Assume that a nonrenewable resource is being consumed that cannot be replaced within the lifetime of the dynasty. Then assume the efficiency of each subsequent unit of resource consumed produces power as a decreasing efficiency. A simple linear efficiency decay function could be:
\(\epsilon = 1 -\left( \frac{current~year – start~year~of~dynasty}{end~year~of~dynasty – start~year}\right) \),
where \(\epsilon\) if efficiency. Then the efficency-discounted power is:
\( P = \epsilon * P_0 e^{kt}\).
Substituting in our functions (utilizing linear decay):
\(Y = e^{kt} * \left( 1 – \left(\frac{t}{(end~year – start~year)}\right) \right) \).
Or,
\(Y = e^{k(year – start year)}*\left(1 – \left(\frac{(year – start~year)}{(end~year – start~year)}\right)\right)\).
This produces a steady rise, a level period and a slightly faster decay. So by discounting exponential growth by decreasing efficiency, we then have a rise and fall pattern that is consistent with the rise and fall of a dynasty.
That negative growth occurs often indicates resource exhaustion. External competition can result in negative growth, but the success of external competition can often be described as a function of internal resource exhaustion.
For example, by the early 13th century, the Byzantine empire had consumed much of its timber reserves, so essential for the maintenance of its navy. The Byzantine capital fell for the first time in 1205 A.D.
Sample Description of the Progression of a Traditional Single Regime
A major dynasty (e.g. China, France, West Africa) would typically begin with a daring, competent, often unpolished leader, but with effective power loosely distributed. The future generations of rulers will become increasingly desirous of luxurious living and will also demand expensive “trophies” such as palaces, major public works or optional conquests. This will stress the natural resources of that society, and the dynasty will experience financial difficulty. Taxes will be raised. Bureaucracy will need to be greatly expanded in order too collect the increased and taxes and to administer increasingly complex tax codes. Internal dissatisfaction will increase, so greater internal military effort will be required to suppress rebellions The dynasty rulers will become increasingly dependent upon their military to maintain internal order and to enforce tax collection. At the same time, the rulers will tend to become increasingly occupied with court etiquette and pursuit of such civilized activities as art and scholarship; but they will become less competent at governance and further removed from the realities of the population they govern. Eventually competing figures from within the society, backed by military figures, will challenge the rulers. These initial challenges will be put down brutally, further increasing discontent, and destroying much of the social structure and institutions required for the effective maintenance and defense of the society and its economy. Due to the decreasing magnitude of economic activity, the population and strain on natural resources will decline, allowing for some recovery of productive capabilities. Then, eventually, further challenges from either within or without the society will replace the dynasty, and a new dynasty will form.
Thermodynamic Interpretation of Sample Description of the Progression of a Traditional Single Regime
A thermodynamic potential has built up. A new major dynasty in effect represents a new collection of heat engines that is capable of consuming such built-up potential. The magnitude of built-up potential is relatively high, so heat engine efficiencies are relatively high. Such heat engines utilize some of their work to produce additional heat engines. The population will rise, and economic activity will increase. As future generations of rulers become increasingly desirous of luxurious living and will also demand expensive “trophies” such as palaces, the thermodynamic costs of maintaining such heat engines will increase. Initially, due to high efficiencies and growth of production, such maintenance costs will not be problematic. Yet while demands for maintenance increase, built-up potential is being depleted resulting in decreasing thermodynamic efficiency. (Although a continuing flow of potential exists from such sources as agriculture, it cannot keep up with consumption). Centralization temporarily successfully regains high efficiencies by increasing economies of scale and allowing access to difficult-to-extract potential (that has a high “activation energy”). Yet thermodynamic maintenance costs continue to escalate while efficiency decreases due to continued consumption of built-up potential. Overshoot results. The dynasty will no longer be able to maintain its structure, and total production (thermodynamic work) declines. This decline continues, but additional attempts at overshoot cause the decline to be chaotic. The population of heat engines continues to decrease. Chaotic decline place the population of heat engines below what can be supported by “renewable” flows of potential. Hence a thermodynamic potential will build up again. Then, eventually, a new dynasty (thermodynamic “bubble”) will form. An exception is where the original built-up potential is from a source that can never be replenished, or that can be replenished over periods of time much longer than a typical dynasty lifetime. Rainforests, agricultural lands vulnerable to erosion, and mineral deposits may fall into this latter category. New dynasties can form in these areas, but their absolute magnitudes may be different from the original regime, since they are consuming a different source of potential. Another exception is where a truly breakthrough technology becomes utilized, such as dynamite versus manual labor for accessing mineral deposits. Very few technologies are sufficiency significant to fit in this category, though, and are usually incremental in nature and are already anticipated by the thermodynamic approach.
Example: Romanov Dynasty
Let us apply the EDEG approach to the Romanov dynasty. Let us assume a conservative 1% growth rate. Let us further assume linear decay from 100% to 0% efficiency. A simulation has been written in the Ruby programming language. This language is mathematically robust, yet involves code that is relatively easy to read and understand. The dynasty is run through the Ruby simulator, using the above parameters. A data table was produced to generate in the plot shown in below.

Efficiency-discounted exponential growth (EDEG)
Here the peak is close to 1820. Napoleon had been conquered, and the dynasty had achieved much of its geographic expansion by them. Yet by this time, social unrest began to shake the Romanov dynasty. Also, note how the dynasty power begins at a level of 1 and ends at a level of 0. This is appropriate, since the dynasty had to begin from something, but typically ends in nothing. For example, the ancestors of the Romanovs existed before 1613, but the entire immediate family was killed during the Russian revolution. The peak occurs at a relative power value of height of 2.6, which indicates that the dynasty was over twice as powerful at its peak as it its beginning. Remember, this model is merely a hypothesis that is either valid or invalid for a particular level of uncertainty. The simulation was run again with higher growth rates. We again assume linear decay from 100% to 0% efficiency (see Figure 8). Note several in the response of power to a changing growth rate parameter. First, a higher growth rate results in a later peak. Second, the total peak to initial power ratio skyrockets as the growth rate is increased. Additional factors can be imposed as adjustment functions. One-time events (such as a rare but large natural disaster) can be superimposed as an event “mask”. It may be of further interest to tie the rise and fall to patterns concerning the production and consumption of resources, to determine what correspondence, if any, there is between physical and political power. This can be explored by utilizing actual physical energy data to produce a model of physical power, and then comparing that model with evidence of political power over time. With the wealth of historical data being gathered in anthropological data warehouses, and other “big data” facilities, this may be accomplished with increasing validity.
Discussion and Future Directions
This discussion of the EDEG approach is more of a barebones beginning than a complete end. It raises more questions than it answers, but it enables a broad framework to answer these questions. This framework acts as a unifying skeleton to link the humanistic elements of history with the quantitative constraints of the physical universe. The power of such a framework should not be underestimated. It is possible to gather quantitative data (or quantify qualitative evidence), perform statistical analysis and accept or disprove hypotheses. Yet such results, while often important, are merely empirical. They are often hard to use to constrain or illustrate each other. In a unified framework, all results act to constrain all other results. When we learn about one thing, we necessarily learn something about everything else. This is where the physical sciences have derived much of their strength. There are many immediately apparent improvements to improve the value of the EDEG approach. One improvement would be to better understand efficiency decay. Another improvement would be to start using actual data of physical energy, to the extent such data is available. Another improvement will be to separate the power level of the underlying society from that of the dynasty. For example, Russia did not disappear upon the death of the Romanov dynasty. On the contrary, it is still one of the most powerful societies on Earth. The brings up the need to be able to model the emergence of a series of dynasties in a way that connects and constrains each dynasty, such as concerning relative strength and timing of emergence. Further, there needs to be a way to compare co-existing dynasties and model their interaction within this framework. While the EDEG approach suggests possible means, the devil will be in the details. [1]Meadows, et al. makes this point in Limits to Growth. [2]For an opposing, but still dire view, see D. H. Meadows et al, Limits to Growth, Universe Books, New York (1972). [3]The work of Forrester on system dynamics and the Club of Rome project Limits to Growthby Meadows et al involve attempts to better understand these limiting factors. The work of M. K. Hubbert and Howard Scott on peak oil and technocratic governance are other examples. [4]M. Butler, Animal Cell Culture and Technology. Oxford: IRL Press at Oxford University Press, 1996. [5]M. Ciotola, San Juan case study. Also see M. K. Hubbert. [6]Heilbroner, R. L., The Worldly Philosophers 5thEd. (Touchstone (Simon and Schuster), 1980. [7]Such curves were proposed by W. Hewitt as early as 1926 (source unavailable).
References
Annila, A. and S. Salthe. 2010. Physical foundations of evolutionary theory. J. Non-Equilib. Thermodyn. 35:301–321. Ciotola, M. 1997. San Juan Mining Region Case Study: Application of Maxwell-Boltzmann Distribution Function. Journal of Physical History and Economics 1. Ciotola, M. 2001. Factors Affecting Calculation of L, edited by S. Kingsley and R. Bhathal. Conference Proceedings, International Society for Optical Engineering (SPIE) Vol. 4273. Ciotola, M. 2003. Physical History and Economics. San Francisco: Pavilion Press. Ciotola, M. 2009. Physical History and Economics, 2nd Edition. San Francisco: Pavilion of Research & Commerce. Ciotola, M. 2010. Modeling US Petroleum Production Using Standard and Discounted Exponential Growth Approaches. Gibson, C. 1966. Spain in America. New York: Harper and Row. Hewett, D. F. 1929. Cycles in Metal Production, Technical Publication 183. New York: The American Institute of Mining and Metallurgical Engineers. M. King Hubbert.1956. Nuclear Energy And The Fossil Fuels. Houston, TX: Shell Development Company, Publication 95. Hubbert, M. K. 1980. “Techniques of Prediction as Applied to the Production of Oil and Gas.” Presented to a symposium of the U.S. Department of Commerce, Washington, D.C., June 18-20. Mazour, A. G., and J. M. Peoples. 1975. Men and Nations, A World History, 3rd Ed. New York: Harcourt, Brace, Jovanovich. Schroeder, D. V. 2000. Introduction to Thermal Physics. San Francisco: Addison Wesley Longman. Smith, D. A. 1982. Song of the Drill and Hammer: The Colorado San Juans, 1860–1914. Colorado School of Mines Press.
Further Reading
Mark P. A. Ciotola, ArXiv, Efficiency Discounted Exponential Growth (EDEG) Approach to Modeling the Power Progression of a Historical Dynasty, submitted on 18 Nov 2014
-
4 Comparing Historical Data to Dynastic Models
First published on . Last updated on March 11, 2020.