Quantitative and Physical History
Basic Modeling Techniques
By Administrator
First published on February 22, 2020. Last updated on April 18, 2021.
Below are several types of function commonly used in modeling.
Linear Models (Straight lines)
A linear model is the simplest form of quantitative model (aside from a single point).
Mathematically, such a model takes the form of:
\(y=mx + b\),
where \(y\), is a variable \(y=x\), is a variable\(m\) is a constant number that determines the slope of the line, and \(b\) is a constant number called the y-intercept.
Graphical Interpretation
Cartesian coordinates are two lines that intersect at a right angle, where the horizontal line represents the x axis and the vertical line represents the y axis of a graph (more accurately called a plot). Such represents the most common type of graph. If a linear model is plotted upon Cartesian coordinates, it appears as a straight line.
Example
For example, the simplest approach to model the power progression of a dynasty is a combination of two linear models. This requires start and end years of the dynasty, and its peak year as input parameters. For a single dynasty, the magnitude of the peak can be set to a nominal value of 1. Simply calculate (or draw) a straight line from the relative power value 0 from the start year of the dynasty to 1 at the peak year. How to select the peak year is less clear. A naïve approach would be to pick the chronological midpoint. An objective selection would be the date of maximum economic production, if that datum is available. Or one could choose a reasonable event, although this is less objective. For example, we will choose 1796, the year of the death of Catherine the Great, one of the most powerful rulers of Russia (Mazour and Peoples 1975). Figure (below, left) shows this first line.
Next, calculate a straight line from magnitude 1 at the peak year to magnitude 0 at the end year, involving the slope and vertical-intercept, shown on Figure 1 (below, right). This model has several disadvantages among which it is discontinuous at its peak and assumes linear growth and decay. Further, it tells us little about what underlying causes and factors may be.
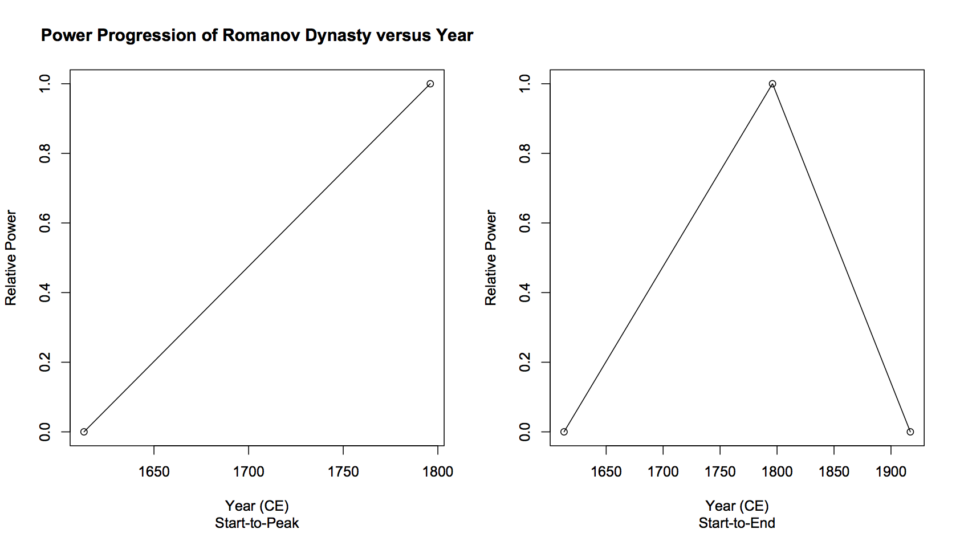
Left: one linear model. Right: two linear models
1.2 Inverted quadratic function
The next simplest approach is to use an inverted parabola function. Geologist M. King Hubbert considered this approach when he modeled peak oil (Hubbert 1980). As before, one can nominally set the peak magnitude. Here, one does not take the peak year as a parameter, but rather sets suitable parameters to that the parabola intersects the x-axis at the start and end dates of the dynasty (see Figure 2). This approach produces models with a rapid growth and decay yet with a relatively long period of relative stability in the midst. A chief disadvantage is that the symmetry of this function forces one to assume a peak year in the mid-point of the dynasty’s life. Also, this model tells us very little about underlying causes.
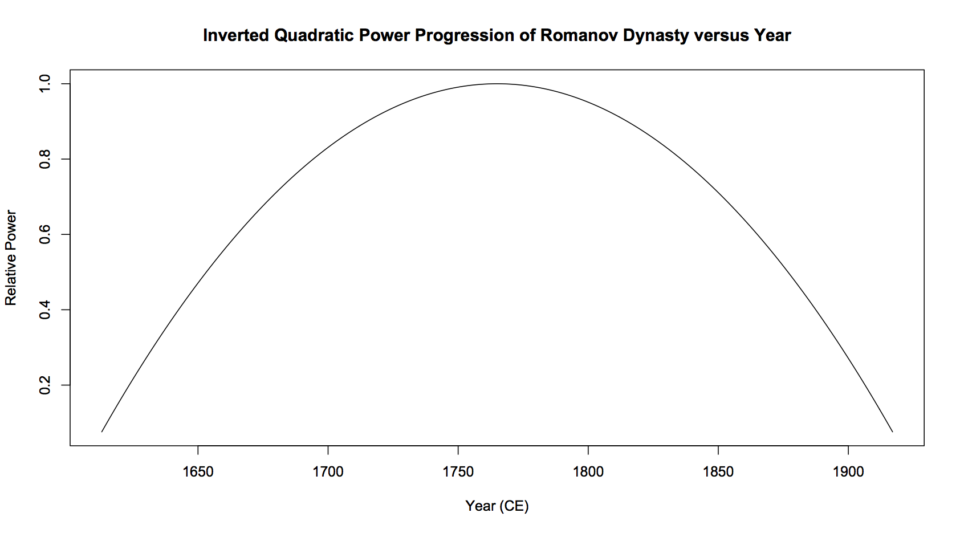
Romanov dynasty modeled by an inverted parabola
1.3 Normal distribution
A more sophisticated approach is to model the dynasty as a normal distribution, or a mathematically similar function. Hubbert utilized bell-shaped plots for peak oil (Hubbert 1956, 1980). Such a function suggests that a dynasty comprises a collection of semi-random, resource-related events that cluster about the dynasty’s peak. This approach can account for resource-based factors, where there is a degree of randomness in the ability to obtain such resources. For example, if there is a resource such as a critical mineral or petroleum where discoveries are to some degree by chance, this approach begins with few mining events, picks up with growth, then levels off with the difficulty of finding new deposits (Ciotola 1997). A chief disadvantage is that this model forces symmetry upon the dynasty’s rise and fall. Another disadvantage is that one must literally begin with the peak and work to the endpoints. It provides no readily apparent means to a priori simulate the emergence of a dynasty.
The normal distribution approach also requires selecting a standard deviation value. Since the vertical axis represents power, and the area under the plot represents cumulative power, then one can set a standard deviation to produce the corresponding percentage of cumulative power. One can also determine the ratio of peak-to-start power, and use that to set the end-points. Note that a smaller standard deviation results in a sharper peak, whereas a greater one produces models that approach an inverted parabola (see below figure). This characteristic can be used to reject particular models based on available evidence.
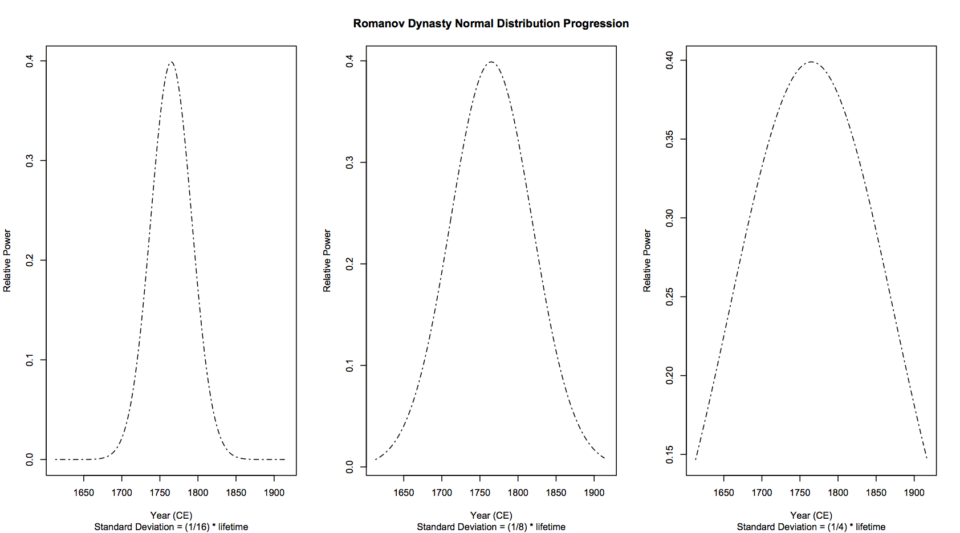
Normal distribution form models for power of Romanov dynasty
Maxwell-Boltzmann distribution
The Maxwell-Boltzmann distribution rises quickly then declines slowly. (It is possible to alter this distribution so that the opposite occurs). This distribution involves a quadratic function leading to a rise, and exponential decay leaving to a fall. So it is a qualitatively reasonable candidate to model the progression of a dynasty. The Maxwell-Boltzmann distribution has most of the advantages of the normal distribution, and it allows asymmetry. Disadvantages may include that this model is less simple both conceptually and mathematically, and requires more parameters than the approaches discussed above. An initial attempt to model the rise and fall (Ciotola 1995) of the Colorado San Juan mining region is shown in Figure 4. The parameters were adjusted to fit several data points provided by a historical account of the region by D. Smith (1982).
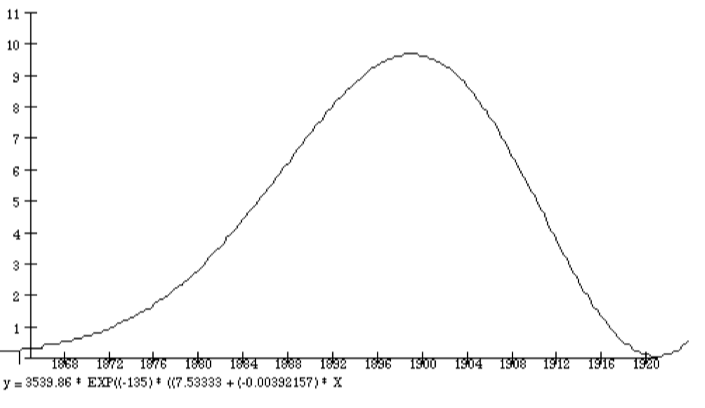
Colorado San Juans gold production versus model
References
- Ciotola, M. 1997. San Juan Mining Region Case Study: Application of Maxwell-Boltzmann Distribution Function. Journal of Physical History and Economics 1.
- M. King Hubbert. 1956. Nuclear Energy And The Fossil Fuels. Houston, TX: Shell Development Company, Publication 95.
- Mazour, A. G., and J. M. Peoples. 1975. Men and Nations, A World History, 3rd Ed. New York: Harcourt, Brace, Jovanovich.
- Smith, D. A. 1982. Song of the Drill and Hammer: The Colorado San Juans, 1860–1914. Colorado School of Mines Press.
« Creating And Using Models | COURSE | Fitting Models to Data »