Digital History
Geographical Information Systems (GIS)
By Mark Ciotola
First published on August 24, 2019. Last updated on February 20, 2021.
Objectives
- Students will learn about geographical information systems as a tool to bring together various information sources to provide a better spatial understanding and visualization of historical phenomena.
- Finally, Geographical Information System (GIS) platforms will be explored. Open-source QGIS will be demonstrated.
- Cloud-based software, such as QGIS cloud, and cloud-based Map Editor will also be demonstrated.
Geographical Information Systems (GIS)
Geographical Information Systems (GIS) are ways to store, view and analyze information concerning areas of the Earth’s surface, such as a neighborhood, region, country or continent. They can even be used for oceans and even other planets.
GIS can be used to create maps, territorial diagrams and visualizations and even perform analysis. A software platform must be used for GIS. There are proprietary GIS platforms with lots of features such as ArcGIS. They cost money, but your university might have a subscription that you can use. You can sometimes get a free trial copy. There are also “open source” or lite versions that you can get for free, such at MIPS or QGIS. It is strongly recommended to go through the tutorial for at least one platform. Most platforms are somewhat similar, so if you know one platform reasonably well, then the others will make much more sense.
Below is an introduction to GIS (credit ESRI):
GIS breaks spatial information down into layers. For example, a base layer might comprise a satellite image. Another layer might superimpose roads and buildings. Another layer might contain labels and annotation. You might import a layer, such as the satellite image, then manually create other layers such as the annotation. There are many types of layers that you can import, sometime from the platform vendor, but often from other sources such as government sites.
Remember that the Earth is not flat! So unless you are working with a small area on the Earth’s surface, you will need to take into account the curvature of the layers you import or add. The larger the area, the greater the curvature becomes. Most GIS platforms will let you choose a coordinate system, but then you must make certain that the other lays will work with it.
Below is an example showing a map with the Hawaiian Island chain in the Pacific Ocean. To the left is a panel showing the available layers. You can choose which layers to display by checking them. Here, the counties (representing islands), cities and urban area layers have been selected. To the right, you can see those layers displayed. At the lower right hand corner, you can see the selected coordinate system.
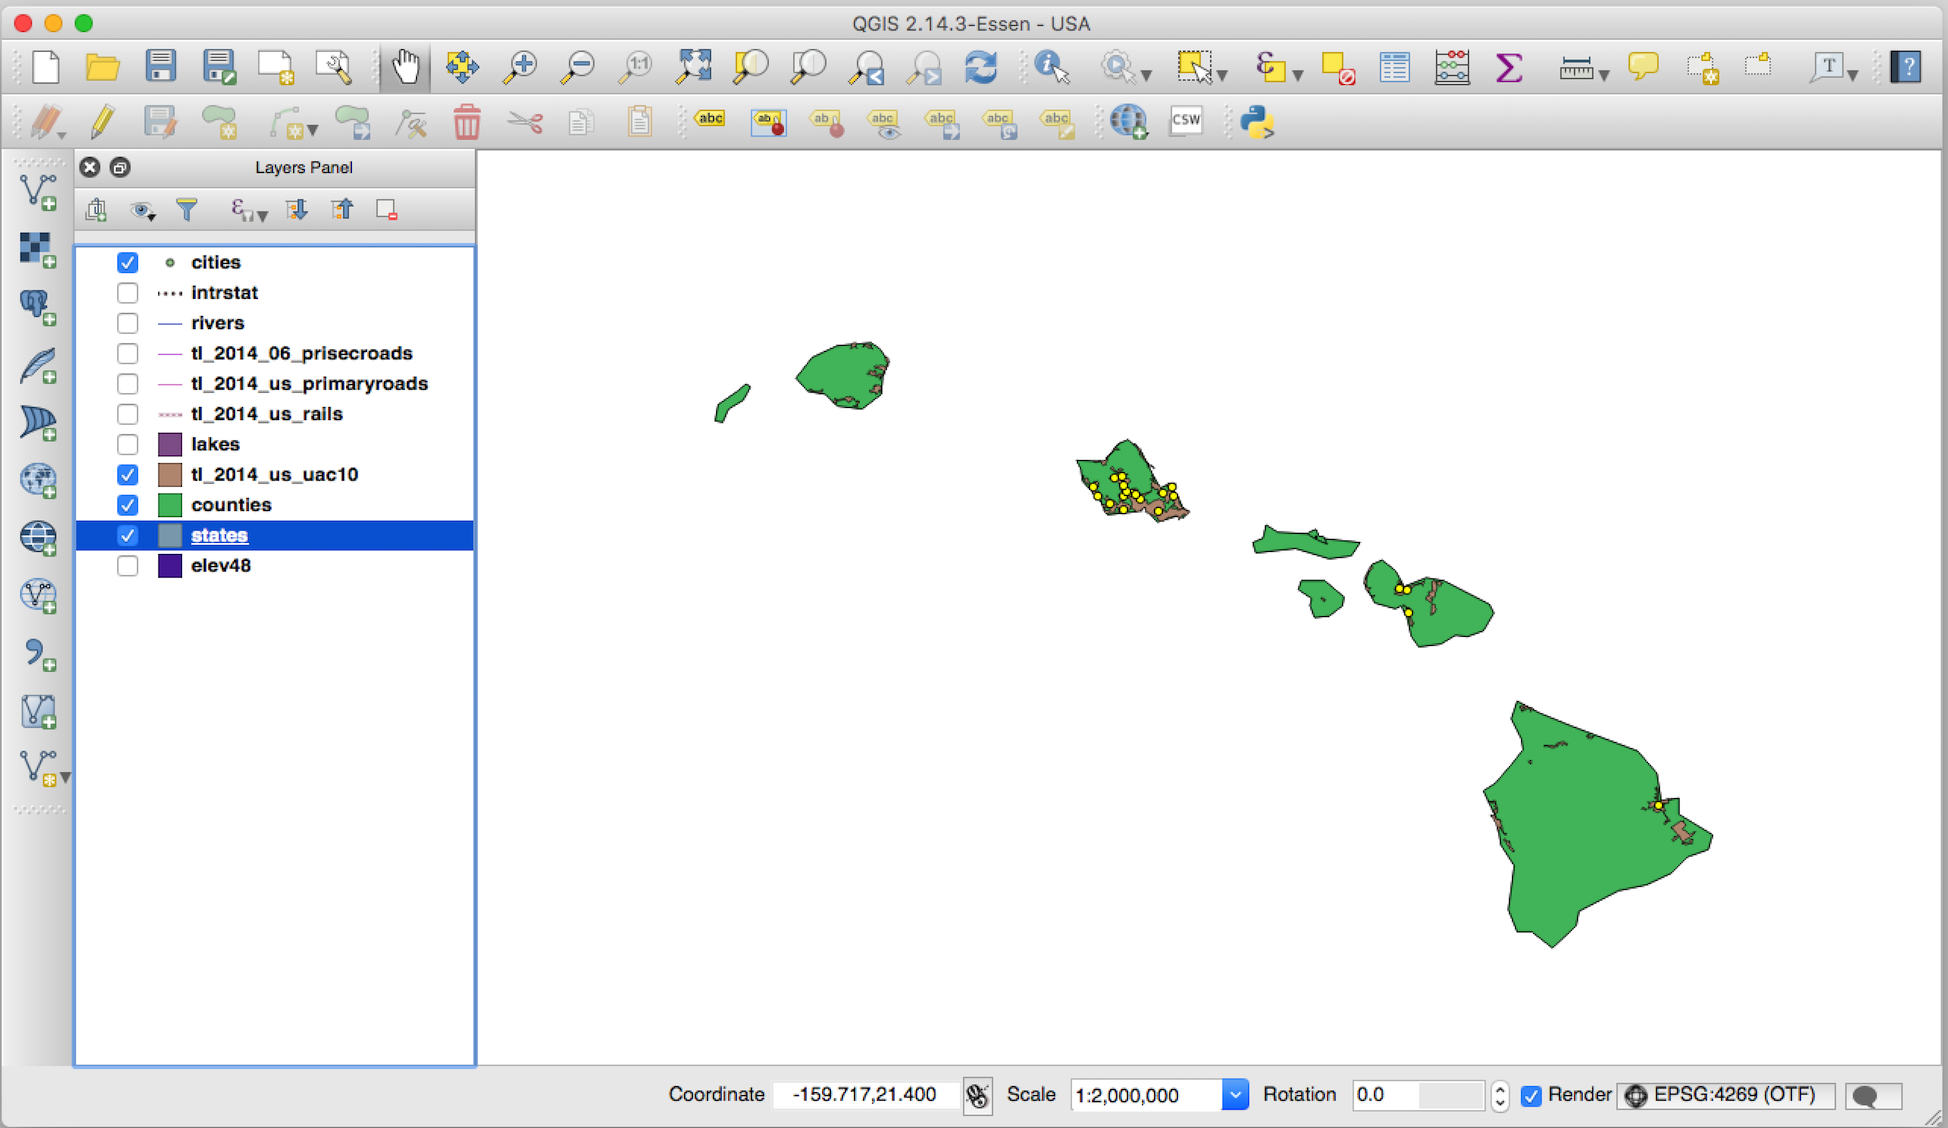
GIS view of Hawaii with cities and urban areas emphasized (QGIS)
Tech Talk
There is one technical detail that is particular important to know. There are two different kinds of layers. You need to keep in mind this difference, because you will sometimes need to be able to handle these types of layers in different ways.
A raster layer is essentially an image comprised of pixels. It may contain a satellite photograph, a scanned hand-drawn sketch or an artist’s rendition. Each point in a raster layer contains data (and often multiple items of data). Raster layers typically must be created and edited outside of a GIS. They also tend to be data intensive. A photograph of the Earth’s surface, such as from an airplane or satellite, is typically a raster image.
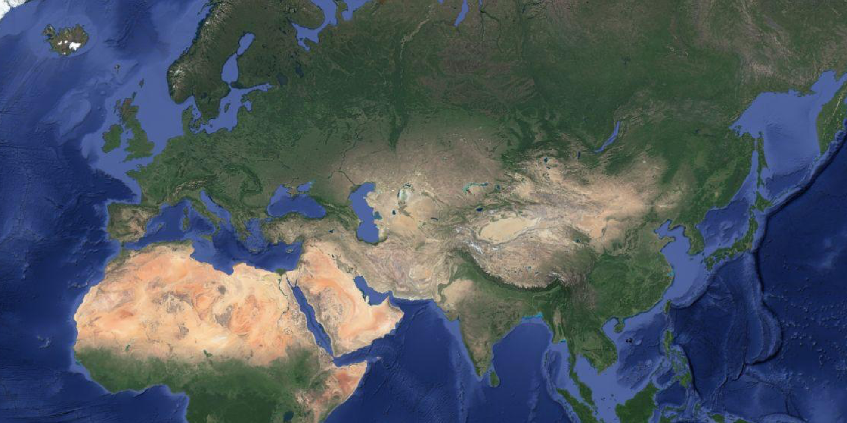
A raster image: satellite image of Asia (credit Google)
A vector layer comprises lines and points. For example, national boundaries can be shown as a series of small line segments, regardless of shape. A vector object can also include a shape that is comprised of line segments that totally enclose a specific area. These shapes can be filled with a color or pattern and still be vector objects. Locations of objects, such as post offices, can be shown by points and icons. Vector layers can typically be edited with relative ease and usually are not very data intensive. Often, one or more vector layers are superimposed upon a raster layer.
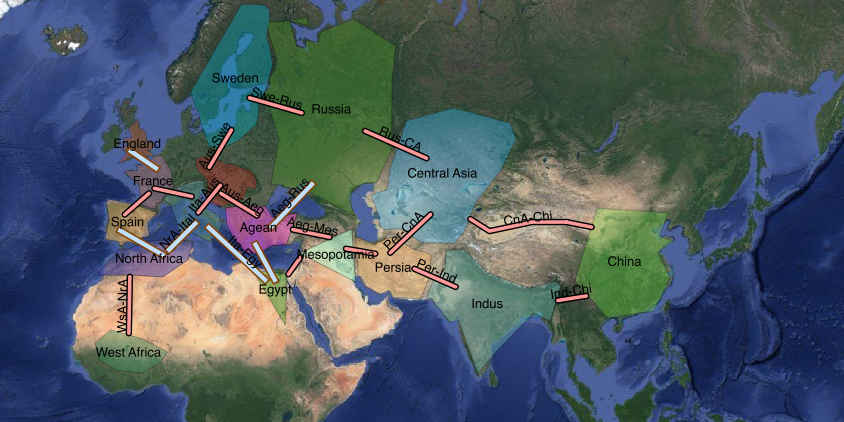
A vector layer superimposed on a raster layer: satellite image of Asia showing political entities and possible connections (raster layer: credit Google)
Another technical detail is that when your GIS territory is either large or is in polar areas, you may need to adapt a special coordinate system. This is because the curvature of the Earth distorts the Earth’s surface. For a small area at a low latitude, ordinary Cartesian coordinates (e.g. flat) may suffice. Otherwise, specialized coordinates will be required to correct for the distortion of the curvature. For many GIS platforms, if you examine the properties of a layer (sometimes via right clicking the layer), you can often see the applied coordinate system.
Resources
- ArcGIS Story Maps.
- Neatline map and timeline tool for Omeka. This tool can provide some of the capabilities of GIS platforms.
Further Reading
- Academia Sinaca, Chinese Civilization on Time and Space
- Gregory, Ian N. and Allister Geddes, Toward Spatial Humanities, Historical GIS and Spatial History. Indiana University Press, Bloomington, 2014.
- Harvard, China Historical Geographic Information System
- National Geographic Society, Geographic Information System (encyclopedia entry, with several informative explanations and graphics)
- Ruth Mostern and Elijah Meeks, U.C. Merced, Digital Gazetteer of the Song Dynasty