Physical History
Modeling History as A Series of Dynasties
By Mark Ciotola
First published on May 17, 2019. Last updated on January 19, 2021.
Describing A Society As A Series of Regimes
A society can be modeled as a series of regimes or Hubbert curves. Each curve would typically represent a dynasty for a traditional historic monarchy. Traditional, monarchical, agricultural-based regimes have historically tended to endure for about 300 or so years. This is a rough rule of thumb. Other types of societies will tend to have a governance change in that period of time but may maintain better legal continuity of government.
Not all regimes last for about 300 years. Where a potential has not restored itself, of those who attempt to rule the regime are not competent (i.e. a defective or inherently inefficient “heat engine”), a regime will be short lived. The other extreme is where the potential is too great. This can happen when neighboring regimes have become weak. In this case, a regime can expand too quickly and become a great, but brief empire. Such appears to have been the case of the first French Empire lead by Napoleon. There are plenty of exception to this 300 Year Rule. Yet, focusing attention on regimes that fit in this pattern can be useful to identify more general principles and constraints that govern humans. This is similar to the case of the development of astronomy, where first the easily observed bodies such as the Moon, Sun and visible planets were modeled first and lead to Newtonian mechanics. Later, smaller, further and more exotic objects were studied and modeled.
Further, the 300 Year Rule is much less likely to be applicable to most of the regimes in existence when this book is written. Few regimes today are traditional agricultural monarchies. Further, regimes have become much more interdependent with each other, so it can be expected that Hubbert Curves will become more distorted and even more merged than any time in the past, even for the largest regimes in existence today. Also, most of the current regimes are dependent upon non-renewable resources such as petroleum that have never driven regimes before the 19th century. Yet, as mentioned above, a study of historical traditional 300 Year regimes can help to develop generic principles that can be applied to a much broader range of regimes.
A common error would be to assume that the series of EDEG curves represents a periodic function. It’s not. However, many functions can be expressed as a Fourier series (a combination of sinusoidal functions) so perhaps a series of EDEG curves can be as well.
Regimes might not follow immediately one after another. Or there could be some overlap between older and newer regimes.
Historical Dynasties
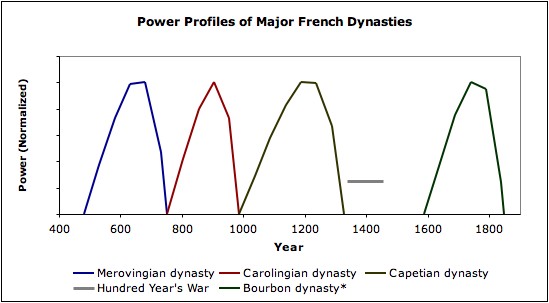
Dynasties in major historical civilizations are typically easy to identify. In a sense, dynasties are what fill the pages of historical textbooks. The flowing is a chronological list of French dynasties, along with duration data.
TABLE: Dynasty Series for France
| Dates (CE) | Regime | Duration |
|---|---|---|
| 481–751 CE | Merovingian dynasty | 270 years |
| 754–987 CE | Carolingian dynasty | 233 years |
| 987–1328 CE | Capetian dynasty | 341 years |
| 1429–1588 CE | Period of relative discontinuity | |
| 1589–1791*/1848 CE | Bourbon dynasty | 202/259 years |
*1791 represents the French Revolution that interrupted the regime that was restored for awhile after the fall of Napoleon until 1848.
It is clear that the dynasties are not exactly periodic (exactly the same length in years as each other).

French dynasties 500-1850 CE

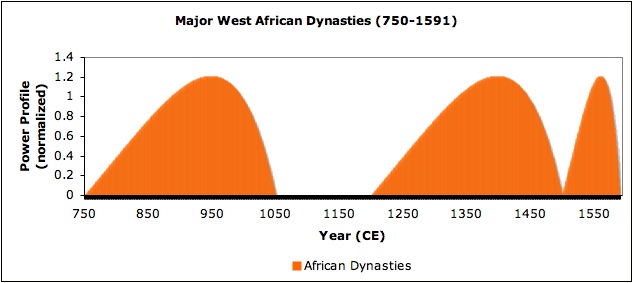
Selected major West African dynasties, 750-1591 CE
Thermodynamic Approaches to Model a Series of Dynasties
An exciting next step it to attempt to model a series of past dynasties. You could simply do this by superimposing a best fit set of distributions over time. This is fairly simple to do any might provide some utility and satisfaction.
However, the above series of French dynasties has been modeled. In this case, each regime was modeled individually using the simple thermodynamic method described. An important point about applying fast entropy to real life situations is keeping the expression “it takes two to tango” in mind. Fast entropy only creates a potential. There must also be the equivalent of an engine (or conductor) to bridge the potential to observe fast entropy in action. In history, that engine may be produced by a new royal family replacing the prior family, or a group of organized invaders. Sometimes that engine comes along immediately after the end of the prior regime, or sometimes it may take a few hundred years before a new major regime takes root.
However, there is a more powerful approach. If you can determine past potential profiles for past regimes, and if they seem consistent or to follow some pattern, then you can create a “boiler” program to literally boil a series of regimes. In that sort of program, potential builds up until it reaches a trigger threshold, then a regime forms and goes through its lifecycle and exhausts the built-up potential and dies. Then the potential starts building up again and eventually another regime forms. If the pattern varies from actual history, it may be possible to identify catastrophes, unexpected events, and interference from more powerful regimes.
If you have appropriate software, you can literally reverse-simulate a past regime to determine a past potential at each point of the regime as well as the total quantity of the CCR. Such parameters can be sometimes useful for forecasts. The function that expresses the potential in terms of time (age of regime) is its potential profile.

Series of Russian dynasties
Dynasty series Involving Nonrenewable Physical Resource
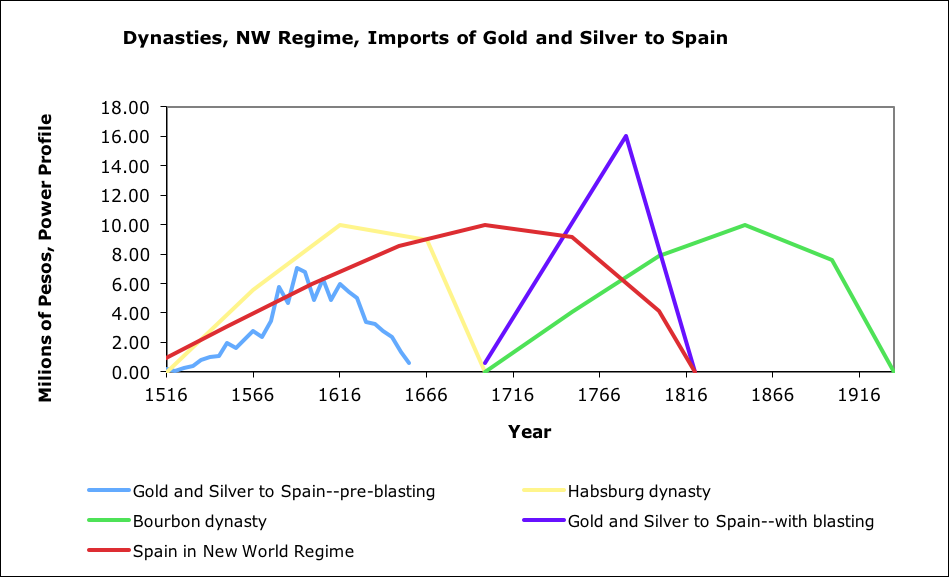
Below is a series of EDEG models for a series of Spanish dynasties where significant extraction of gold and solver occurs. The presence of tremendous metal extraction may have shortened the life of the Habsburg dynasty. Model for extraction with blasting is based on one data point, and is largely conjecture. Bourbon dynasty is considered to have ended with takeover by Francisco Franco, regardless of present monarchy.

Spanish dynasties 1531-1930s with some metal extraction data
For data, see Gibson, C., Spain in America. Harper and Row, 1966.
« Secondary Dynastic Events | COURSE | Interrelations Between Concurrent Dynasties »