Computer Skills for Research
Plots
By Mark Ciotola
First published on October 10, 2019. Last updated on February 6, 2021.
Plots (also called graphs) are a way to visualize data. The most common plot involves two perpendicular coordinates, and dots, or symbols representing the data. Line(s) may be plotted to indicate a trend through such data.
Plots are typically used to show relationships between items of data or factors. Most plots are two-dimensional, being the easiest to visualize on a computer screen and print on paper. So they typically show a relationship in data or a simulation between two factors. It is possible to have more dimensions or factors, but more complexity can make a plot more difficult to understand.
There are some easy-to-use free or inexpensive graphing programs. For example, Grapher is included with most Macintosh computers. Such programs are good enough to visualize many mathematical functions. However they are insufficient to plot data or output graphics for scientific uses. The Google spreadsheet application can also produce basic plots.
Good plotting software can be a bit expensive for those on low budgets. Fortunately, MS Excel is good enough for most purposes, often supplied under site licenses to entire schools and universities, and offers a graphical user interface. For more sophisticated or customizable plotting, the R language and environment are free, but require know a little coding (fortunately there are lots of free online guides for the basics).
Types of Plots
There are several types of plots. A common type is a column plot (shown below). Column plots are easy to understand and are thus popular for presentations. The magnitude of each data item is simply the height of the column.
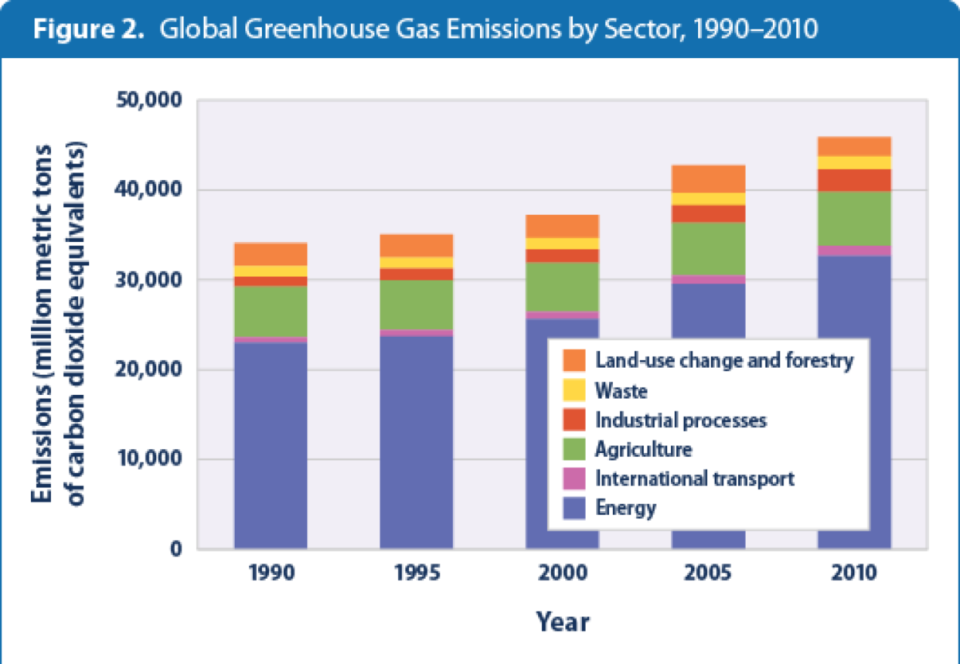
Credit: US. govt.
Another type is the scatter plot (shown below). A scatter plot allows more data points to be shown, and is good for either comparing numerous relationships, or for comparing a set of data points with a model or predictions.
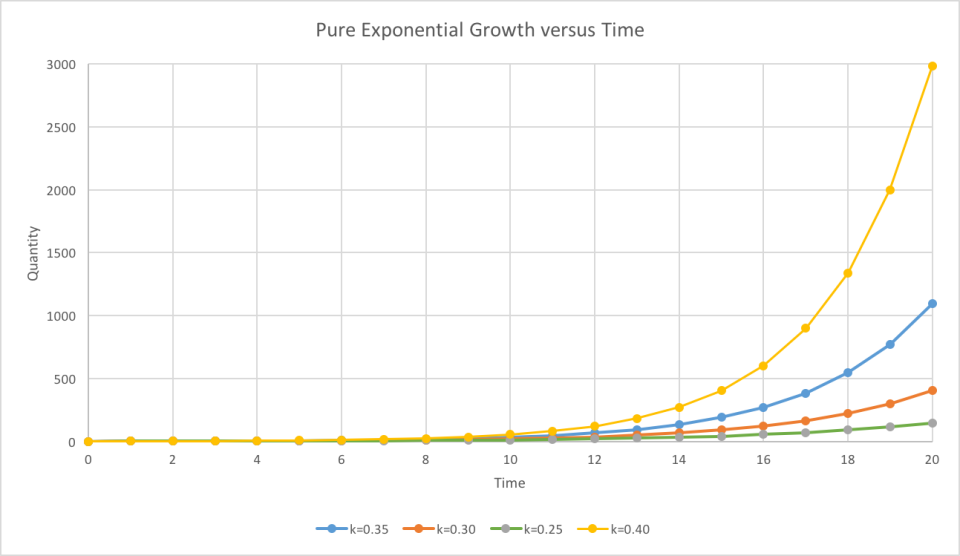
Microsoft Excel plots of various rates of exponential growth