Digital History
Spatial and Network Simulations
By Mark Ciotola
First published on August 24, 2019. Last updated on June 14, 2024.
Objectives
- Students will learn about spatial and network simulations such as cellular automata, networks and geographic relationships and the tools to develop such simulations.
- Students become familiar with the applications of such simulation techniques to spatial history.
Introduction
Spatial history concerns the presentation and analysis of historical phenomena over areas of territory. Several tools can be used. Geographic Information Systems (GIS) are a popular tool, but require their own discussion.
Network approaches represent a society as a collection of interconnected nodes and study interactions via those connections. The nodes can be represented as objects (such as points, circles or otherwise) and the connections can be represented as lines or pairs of nodes.
Spatial Simulations
Spatial simulations typically involve a historical phenomena taking place over an area of land. That area can be represented on a map, satellite photo, floor plan or even a curved surface such as a globe.
There are several tools commonly used for spatial history. Some tools are primarily for display and analysis, such as Geographical Information Systems (GIS), sometimes called Historical Geographic Information Systems (HGIS). Other can actually conduct spatial simulations. The most common such tools are cellular automata. Such comprise an area (typically broken up into a grid or “cells”) upon which agents (representing objects such as people, animals, ships) exist. Some agents can move about, reproduce, consume resources and engage in other activities.
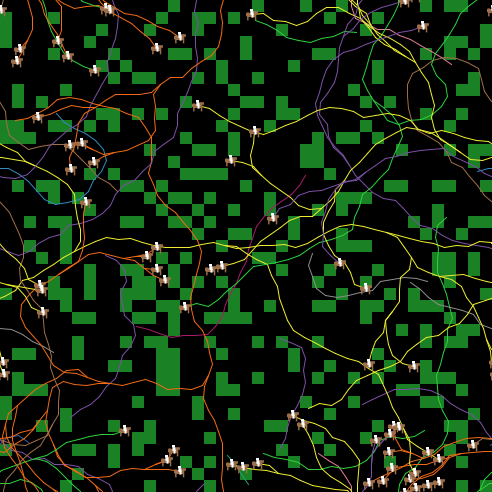
Riders on horses roam a grassy plain, leaving behind a trail to mark their claimed territory.
NetLogo is a popular tool for cellular automata (see above image), although it does require writing code. Cellular is an easier platform that offers a drag-and-drop interface.
Scalable Vector Graphics (SVG)
A good tool for displaying networks is Scalable Vector Graphics (SVG), which is a language that can produce graphics. It is intended to be embedded in html (web) pages. It works best to produce graphics with lines and shapes rather than photographic images. It works well to produce network diagrams.
How to Use SVG
SVG is code is simple to write, but it tends to require a lot of planning or trial and error to get everything to appear as desired. First, an area (canvas) is declared with a width and height. Then various objects, such as circles and a line are declared. You have to specify the position of each object on your canvas, as well as its size and color. Some objects such as ovals have additional characteristics to specify. Then the code is inserted into the body section of an html page.
The following is an example of SVG code.
<svg width="300" height="200">
    <line x1="50" y1="50" x2="200" y2="50" stroke="blue" stroke-width="2" />
    <circle cx="50" cy="50" r="40" stroke="black" stroke-width="4" fill="cyan" />
    <circle cx="200" cy="50" r="40" stroke="black" stroke-width="4" fill="yellow" />
<svg>
The output would appear thus:
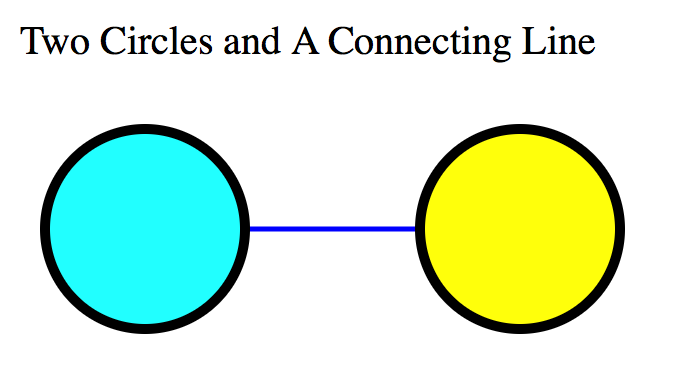
A simple SVG example.
SVG Used in A Simulation
Below is an example of a web simulation utilizing SVG. You can see how code similar to that above has been reused many times to form a more complex network diagram. It is possible to combine SVG with scripting languages to produce a dynamic simulation, or to trigger snapshots at any particular time (using the buttons). The code for the below simulation is more extensive than for the above example and too long to show here. However, the code is highly redundant, and it is not difficult to write.
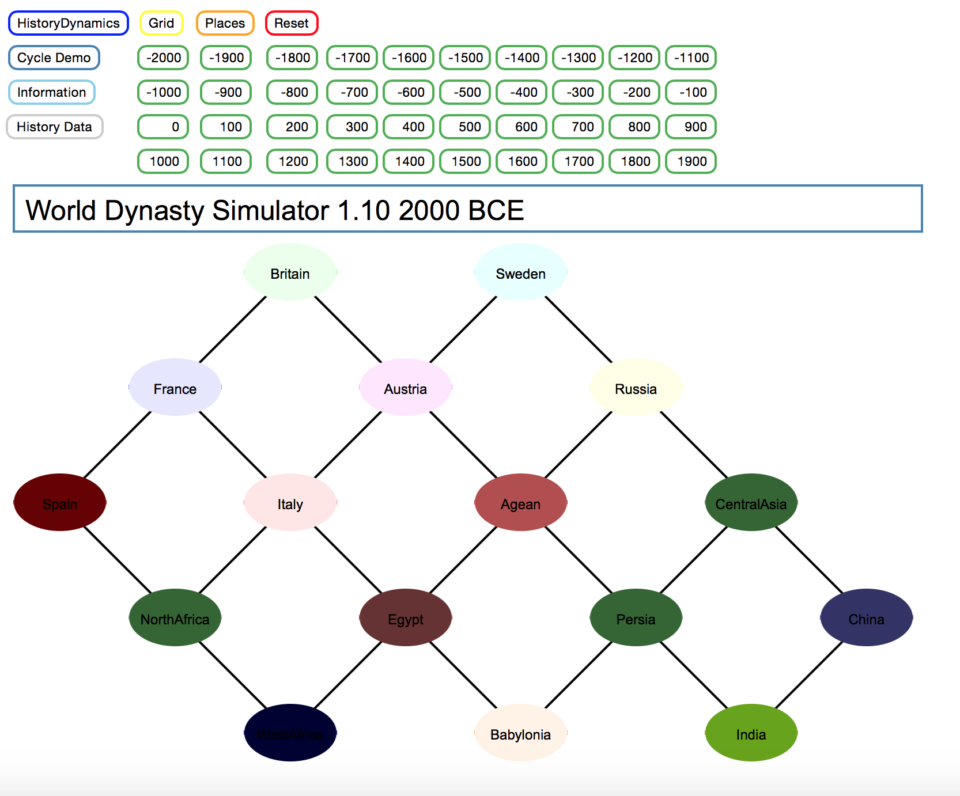
History Grid (created in SVG)
Scripting in JavaScript
Javascript is a scripting language that is executed in web pages. It can be included directly in html files, or it can be in its own file and referenced by the html file. Javascript is responsible for much of the interactivity you encounter in webpages. Javascript can manipulate many of the objects in a web page.
Generally Javascript must be enclosed in script tags.
Let’s explore a simple script included in an html page. Below is some HTML code for a button, followed by some Javascript code. Clicking the button will pop up an alert window displaying “Hello!”
<button onclick="myPopupBox()"> Click here</button>
<script>
  function myPopupBox() {
    alert("Hello!");
  }
</script>
D3 JavaScript library
D3 can be used for visual simulations with some interactivity. D3 is a Javascript Library to produce animated data visualizations. It drives many of the data visualizations you see online, such as in the New York Times. D3 is relatively easy for some tasks, but not others. It is much easier to use D3 if you already know some Javascript.
Resource
- So see some live D3 demonstrations and for more information, see the d3 site.
Historical Applications
Now that you have seen some of the technologies, lets explore some of the historical applications of spatial history. One such application is ORBIS: the Stanford Geospatial Network Model of the Roman World. ORBIS shows Roman communication costs in terms of both time and expense by simulating movement along the principal routes of Roman road, navigable rivers, and sea routes in the Mediterranean. You can try out ORBIS by opening the above link.
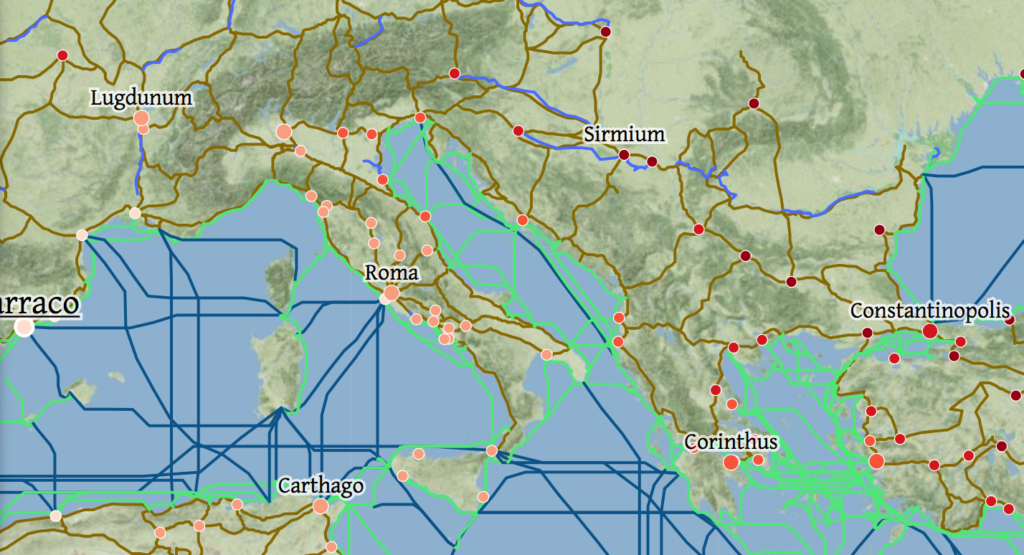
ORBIS (credit Stanford U.)
Cellular
Cellular automata are an approach to simulate spatial social systems. They typically use a grid to represent space and agents to represent actors.
Try to create a system of interacting agents in Cellular, a Snap App application written by Monash University. For example below is a simulation of cows grazing. The green areas represent grass. The intensity of the green represents the height of the grass. As a cow grazes, an area of grass becomes depleted.
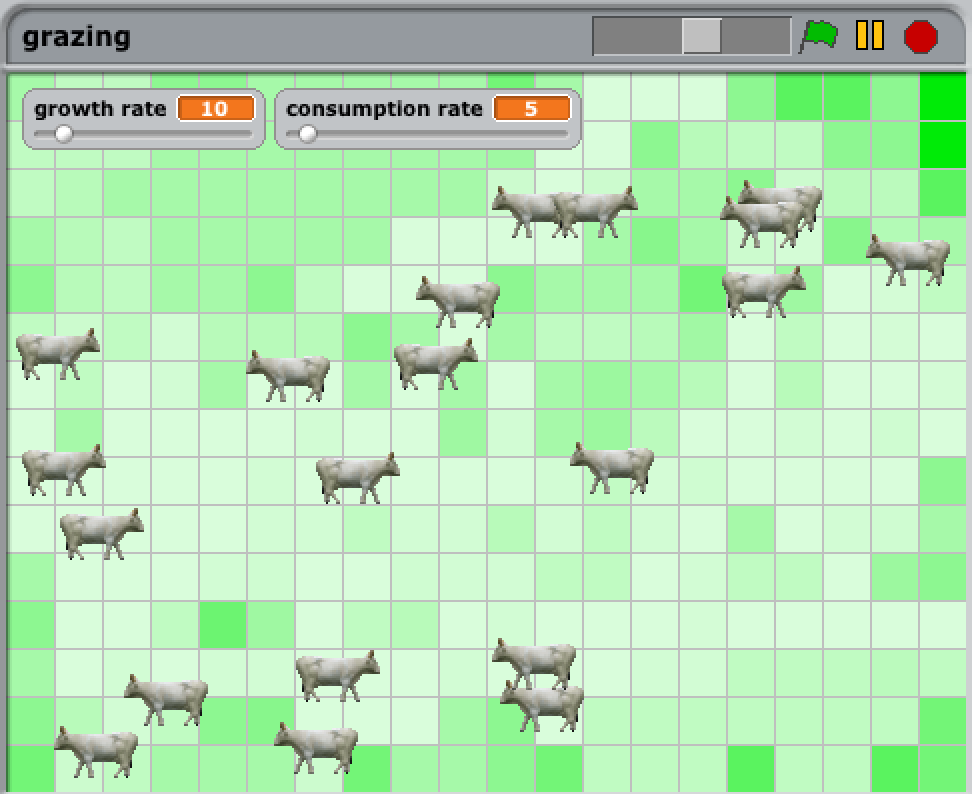
Cows grazing in Cellular simulation (Credit: Bernd Meyer at al., Monash University)
Below, we can see a video of the simulation in action, with cows moving about the field. Here, the agents are cows. In historical simulations, the agents could be invading raiders, lumberjacks, or other parties that can either move about or expand their territory.
Organizations, Conferences and Projects
- European Social Simulation Association (ESSA)
- MURI Migration Project
- Stanford Spatial History Project
Resources
- Open ABM
- NetLogo
- Social Simulation 2019 (course at U. Utrecht)
Further Readings
- Journal of Artificial Societies and Social Simulation (JASSS) contains articles on agent-based and spatial simulations.
- SVG Tutorial (w3schools.com)
- Cellular book (Apple Books).
« Computational History and Simulations Activities | COURSE | Spatial and Network Simulations Activities »