Make sure you scroll to the bottom of this page to see what a correct R script (with an extension .R) for this assignment should look like !!!
Goals:
- Create an R script to run basic commands to obtain mean, median, standard deviation and summary for data sets.
- Acquire a sense of the size of the mean, median and how “spread out“ a small set of observations are. For example, when we say the standard deviation is 2, how spread out do we expect our data values are around the center and from each other? Of course, we can always easily calculate the mean, median and standard deviation by our calculator or R. But it is important to get an intuitive feel for these measures.
Instructions
Please follow the instructions below carefully as that’s how the grader grades your assignment. Computer work is all about details!
1) This homework set is based on Lesson 2 — Basic Commands and scripts. So you need to watch the video in Lesson 2 BEFORE you do this homework set.
2) There are altogether 5 questions in this homework.
-
- Create a R script to type your R commands for the 5 questions below.
-
- At the top of your R script, use # to type your name (it is optional to include other information such as assignment name, etc).
-
- For each question, use # to type the question number.
-
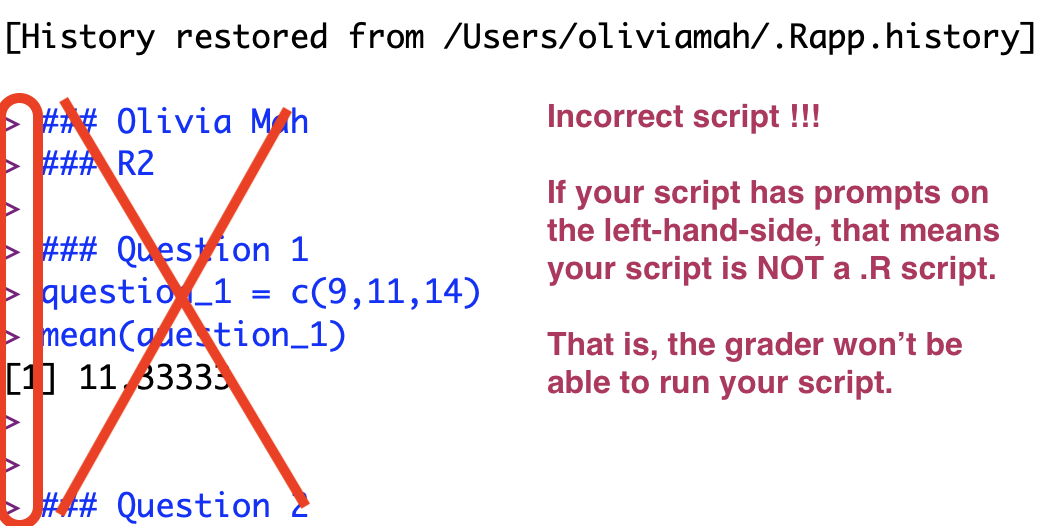
- Upload the R script (with the file extension .R) to Canvas. Canvas will only accept a file with the .R extension. That’s ALL you need to upload to Canvas for this assignment —DO NOT upload a .txt file !!! (A .txt file will have a bunch of prompts > in it. See script B at the bottom of this page.)
- Upload the R script (with the file extension .R) to Canvas. Canvas will only accept a file with the .R extension. That’s ALL you need to upload to Canvas for this assignment —DO NOT upload a .txt file !!! (A .txt file will have a bunch of prompts > in it. See script B at the bottom of this page.)
-
- Make sure your R script works because the grader and I will run your R script and grade the results generated from your R script.
-
- Scroll to the bottom of this page to see what your .R script should look like.
Here are the 5 questions in this assignment:
1) Create an object (a vector) with the following properties:
-
-
- 3 different numbers such that the mean is between 11 and 13 inclusively (that is, the mean can be 11 or 13 if you wish)
- the mean does NOT have the same value as any of the numbers in your object
- you can name the object (vector) anything you want
-
Run the mean () command in your .R script.
2) Create an object (a vector) with the following properties:
-
-
- 5 different numbers such that the median is between 20 and 25 inclusively
- you can name the object (vector) anything you want
-
Run the median () command in your .R script.
3) Create an object (a vector) with the following properties:
-
-
- 5 different numbers between 10 and 90 inclusively
- the mean is smaller than the median
- you can name the object (vector) anything you want
-
Run the summary () command in your .R script.
4) Create an object (a vector) with the following properties:
-
-
- 5 different numbers between 10 and 90 inclusively
- the standard deviation of the 5 numbers is between 1 to 3 inclusively
- you can name the object (vector) anything you want
-
Show the sd () command in your .R script.
5) Create an object (a vector) with the following properties:
-
-
- 5 different numbers between 10 and 90 inclusively
- the standard deviation of the 5 numbers is between 6 to 10 inclusively
- you can name the object (vector) anything you want
-
Show the sd () command in your .R script.
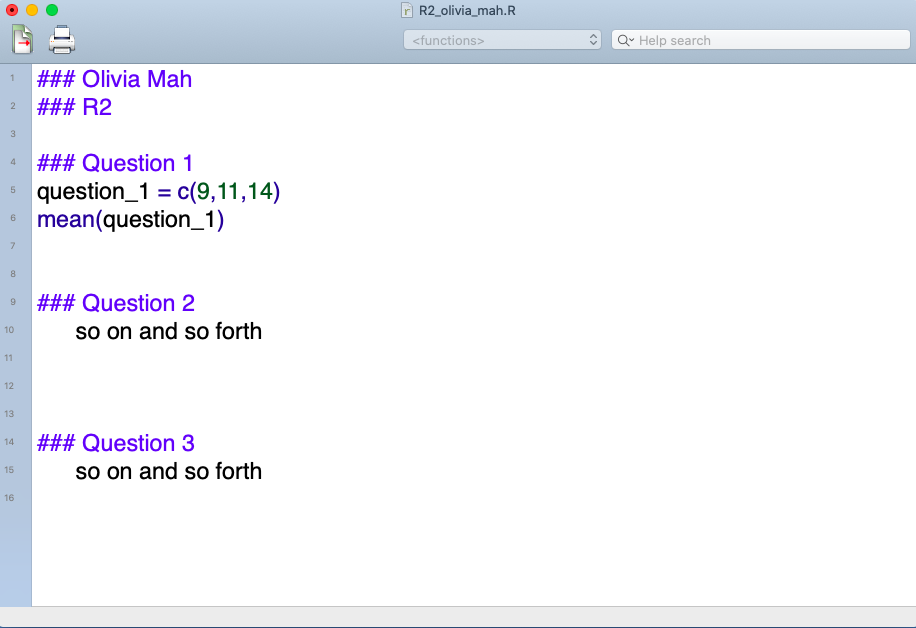
Here is what your .R script should and should NOT look like:
- DO NOT copy and paste the results generated on your R Console on your R script — all you need in your R script are the R commands only!
- Notice that your script should NOT have a prompt > in each line. Compare the two scripts A and B below. A is a correct script but B is NOT.
Script A:
Script B: Incorrect script
-END-