Digital History
Satellite Imagery Activities
By Mark Ciotola
First published on February 15, 2020. Last updated on June 13, 2024.
Google Earth
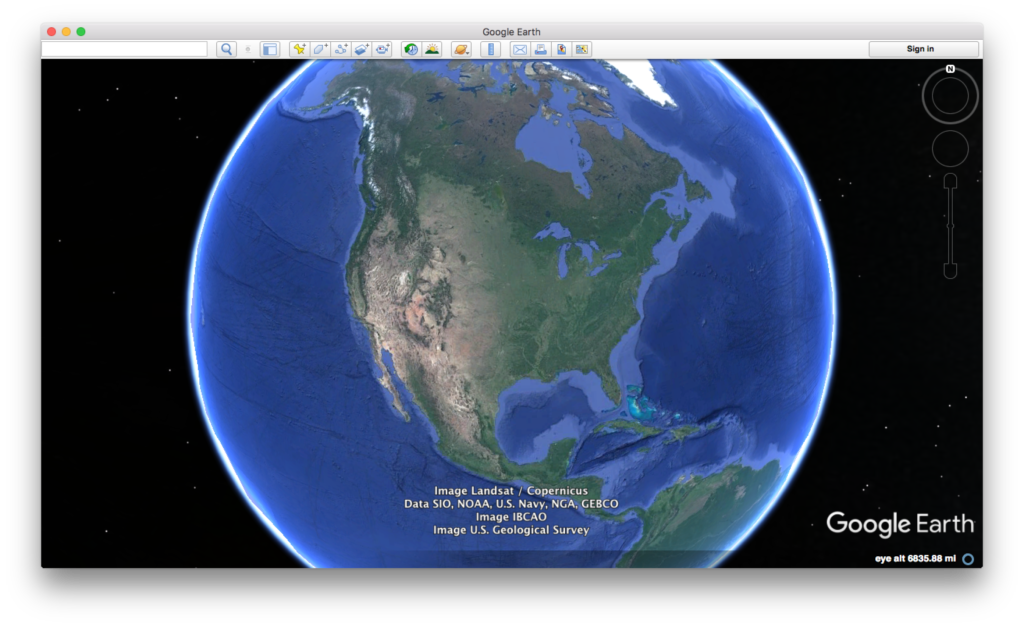
Google Earth provides an easy way to get free satellite imagery, although what is freely available is quite limited in terms of time frequency and resolution.
- Go to the Google Earth website and download Google Earth.
- Open Google Earth.
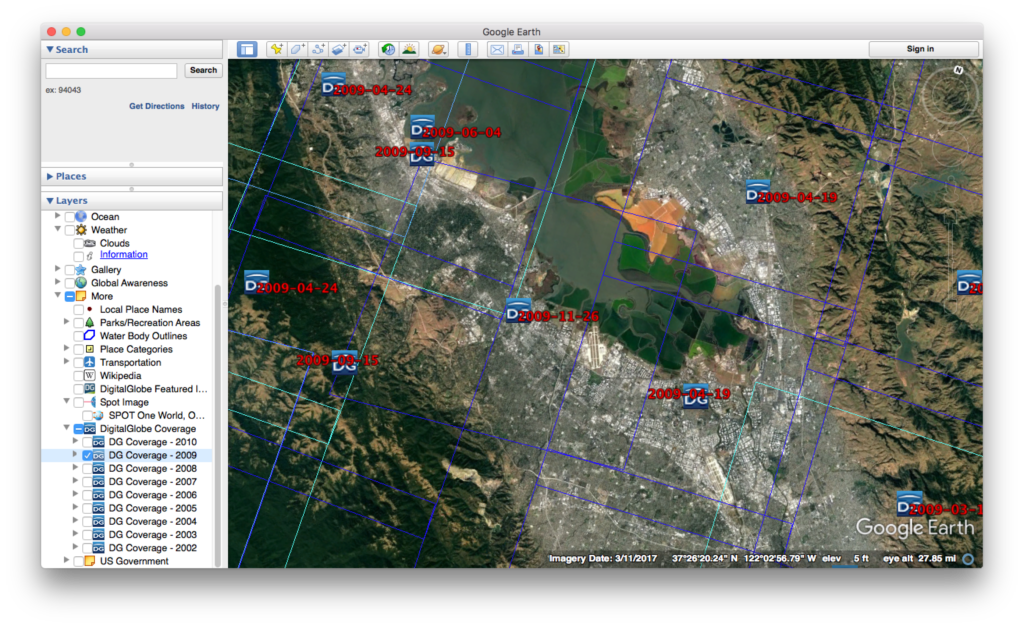
- Click on the button to the right of the magnifying glass to see panels.
- Choose the Layerspanel to see available satellite images and sources.
Credit: Google Earth
Credit: Google Earth
ESA Sentinal
There are five ESA Sentinel missions, each of which concentrate on different capabilities.
-
- First sign up for a Copernicus account using Open Hub.
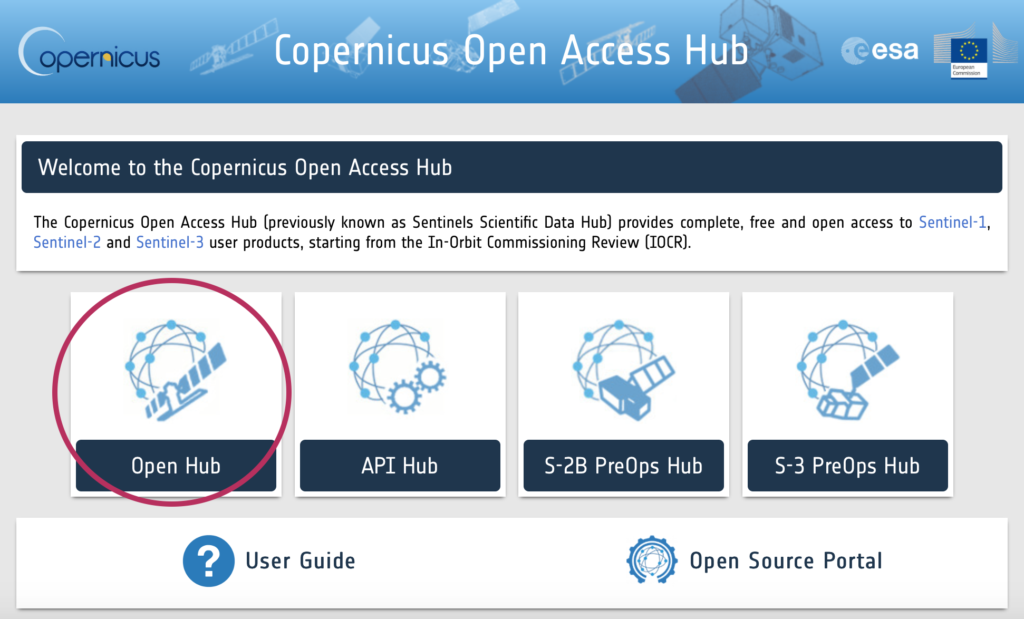
Copernicus main page
- Let’s look at visible images (some infrared bands might be available)
- Install the Sentinel 2 – Toolbox
- Obtain an image through Copernicus.
- Load the image into the toolbox.
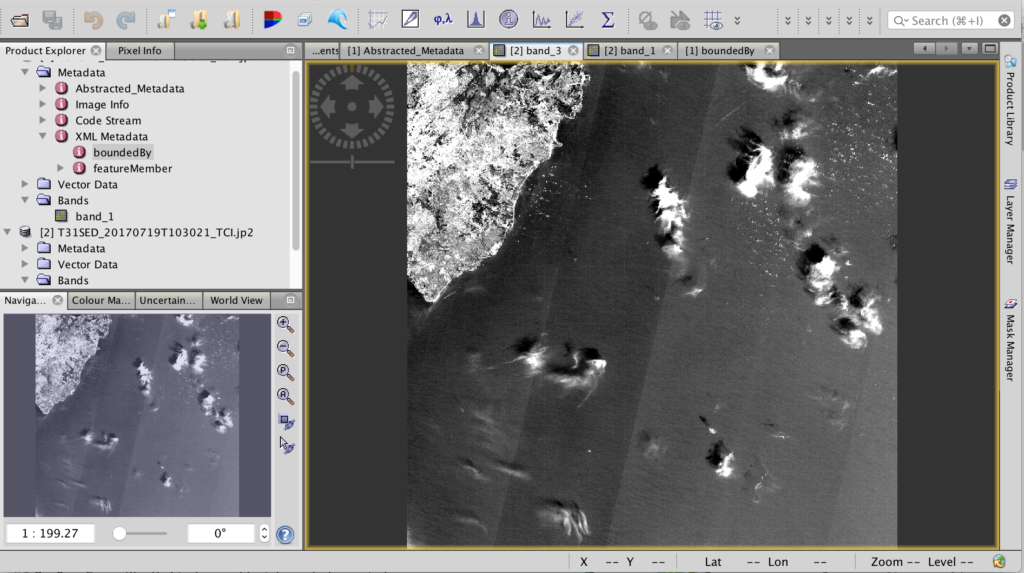
Sentinel Toolbox 2
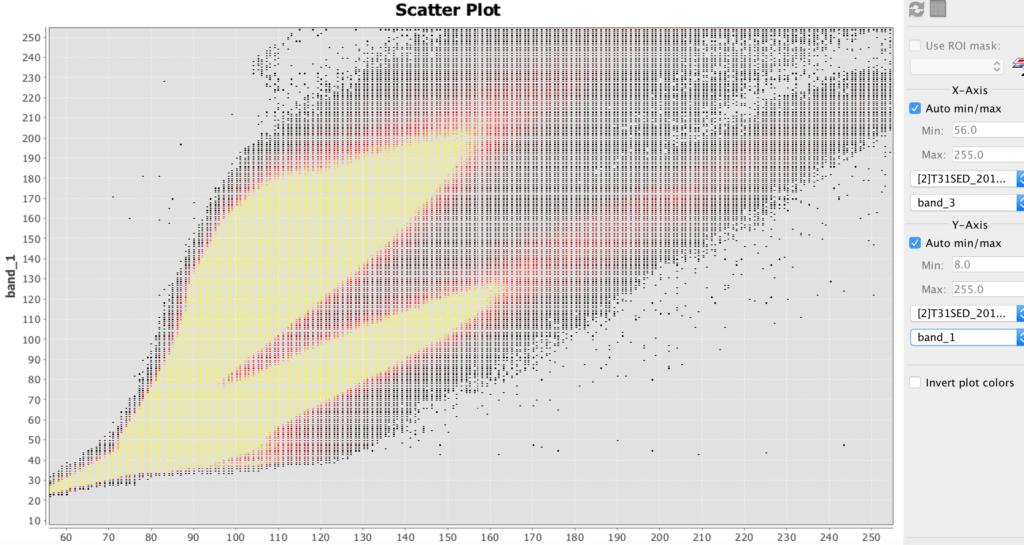
Sentinel Toolbox 2 scatter plot example
HDF
- HDF stands for hierarchical data file. It is used for some remote sensing files.
- Install HDFview for hierarchical data files (.h4, .h5, etc.)
- Download this file: BUV-Nimbus04_L3zm_v01-00-2012m0203t144121.h5.txt
- Open up this file in HDFview.
Hyperspectral Images and Analysis
Hyperspectral allows you to determine the materials viewed with much greater precision than most other methods. The amount of hyperspectral imagery available (especially for free) is quite limited, but the quantities should greatly increase in the next few years due to new missions by Satellogic and Planetary Resources.
The best way to learn how to use hyperspectral images is to download the TNPmips GIS software and go through the hyperspectral tutorial on that site.
- Datum (formerly TNTmips) is GIS software that has a hyperspectral analysis component. There is a free version.
« Obtaining, Processing and Analyzing Satellite Imagery for Historical Uses | COURSE | Level Up: Satellite Imagery »